Tag Archives: public libraries

Is the Library eBook Market Working? Identifying Areas for Further Investigation

With the obligation to close their doors for the safety of users and staff alike, the ability of libraries to offer services digitally has never been so important.

Libraries have responded, diverting available resources and energies into providing online storytimes and consultations, and developing their presence on social media.

Some have sought to reassign budgets from physical to digital collections, sometimes with supplementary funding offered by public authorities. This experience is, for many, making clear the differences in what libraries’ money can buy in the offline and online worlds, especially as concerns eBooks.

This is not a new concern of course. Libraries have been highlighting concerns about the way the library eLending market has been working for years, with high prices, restrictive terms, and simple non-availability of works all regularly featuring.

While much of the attention has been on ‘trade’ eBooks – those lent out by public libraries – this is an issue that also affects academic libraries (as our interview with Johanna Anderson underlined).

In terms of solutions, the focus has tended to be on copyright, and how to update rules in order to ensure that the provisions that allow for libraries to work with physical books should apply also to electronic ones.

However, copyright – as well as exceptions to it – are a response to problems in a market, either because a public good is not being supplied, or because the structure and operation of the market is working to the disadvantage of one party or another. This, of course, is the job of competition and consumer policy.

Following on from an earlier blog on this site about how competition – or anti-trust – policy applies in the world of libraries, this one looks to explore what evidence we have – and what evidence we might need – in order to encourage competition and markets authorities to look into the way that library eBook lending operates.

To do so, it will look at a number of the steps usually taken in competition investigations in order to assess the need for an intervention.


Are there excessive profits?

A first potential indicator of problems with the market is when producers are making profits that can be considered higher than usual.

The theory at least suggests that if a market is competitive, then high profits will tend to attract more companies. This will generate more competition, which will drive profits down, for the benefit of consumers.

Looking at eBook markets, it does not seem to be the case that ‘trade’ publishers are enjoying huge profits, although the big players have seen rises in recent years, often however on the back of audiobooks.

On the academic side, major publishers do make high profit levels, although again not necessarily just on the back of their eBook operations.

However, profit levels alone are not a sure sign of a competition issue.


Is the market concentrated?

In many investigations, the next place to look in trying to work out whether a market is not working is whether there is a limited number of competitors. A large share of the market held by just one or a few companies could indicate a problem.

When it comes to eBooks, the picture is different for ‘trade’ and academic books. In the case of the former, there are plenty of publishers putting out novels and other materials.

With academic journals, there is a well-documented concentration of much of the market in the hands of a number of publishing companies, and concern every time that there is talk of a merger or take-over.

However, even were one of the big publishing companies to disappear, the market would remain to compare favourably with that for internet providers or airlines in many countries.

Of course, this is to assume that the market is for eBooks in general. Alternatively, we can look at the market for a single book. In this case, the rightholder has a monopoly thanks to copyright.

Clearly this is a violation of perfect competition, but one that – at least theoretically – can be justified in terms of giving the rightholder the time they need to recoup their investments. Whether the current length of copyright terms in international law has anything to do with economic logic is another question.

Crucially, the monopoly awarded to the rightholder of a particular eBook is easier to justify when these are substitutable – i.e. when eBook A by publisher X could broadly be replaced by eBook B by publisher Y.

When, however, this is not the case – i.e. because a student or researcher needs a very specific work, or a library card-holder wants to read the latest bestseller, not something a bit like it – there is more of a challenge.

Another solution would be to allow physical books to compete – for example by allowing a library to digitise a physical copy in their collection, and give access on a one-copy-one-user basis. However, this idea is deeply contested.

Even initiatives focusing on out-of-commerce works, such as Controlled Digital Lending, have led to threats of legal action, while the Hathi Trust’s work to provide digitised copies of books now is largely justified by the fact that access to physical copies is impossible.

Were a competition investigation to be launched, a key question would therefore be how the market is defined, and whether allowing physical books to compete with eBooks could bring a degree more competitiveness to markets for individual works without undermining the possibilities for rightholders to recoup investments.


Are there barriers to entry?

A further step in an assessment of competition is to look at whether there are issues that may be preventing competitors from entering a market, and competing with existing companies by offering cheaper alternatives.

Clearly if we are considering each individual eBook as a separate market, then there is a huge barrier to entry – copyright. But as suggested before, just like other forms of intellectual property, copyright at least originally had a form of economic logic.

But even if we look at academic eBooks as a whole, there can also be challenges. As set out in our interview with Johanna Anderson, publishers can tend to want users to access their eBooks through their platforms.

However, if libraries don’t want to – or can’t – buy access to every platform available, the only alternative  is to buy individual eBooks from vendors, but often at prices which have been set many times higher than those of print equivalents. This serves to push libraries towards publisher platforms, despite the fact that the library may only want a small share of the eBooks available there.

The effect of this is, effectively, to push libraries towards buying access to bigger platforms, potentially at the expense of spending on smaller, newer publishers.

This risks creating a barrier to entry by smaller players (or forcing them out of the market) by making it more difficult for libraries to allocate money more freely between publishers on the basis of what users actually want.

This situation is similar to that already seen with the ‘big deals’ offered for bundles of journals, which a number of countries are beginning to seek to abandon, even at the risk of losing access to content that researchers and students want.

In the trade eBook sector, there can also be issues with barriers to entry, for example when libraries or library systems are obliged to buy a fixed number of books.

The same goes when it is possible to sell bestsellers under terms that mean that they ‘capture’ large share of library budgets, leaving less space for new or emerging voices. In each case, established players gain an advantage that risks creating barriers for others.

A competition investigation here could shed more light on the subject of whether specific practices of bundling, or minimum purchases, have a negative effect on new entrants or customers.


Is there market power?

A final issue to explore, linked to the question of barriers to entry, is whether a particular player enjoys market power.

This implies that one side of the equation (a producer or buyer) has a freedom to change conditions – for example by raising or lowering prices, or imposing tougher or looser terms – and the other has little option but to accept, for example because there is no alternative.

This can be a real concern for libraries faced with demand from users – from readers coming to a public library, to students or researchers at an academic one.

As already underlined in the previous section, the way that the academic eBook market works can make it possible to increase prices steeply while libraries have little option other than to accept, or face frustration from users.

Similarly, the work carried out by the library eLending project in Australia has underlined to what extent libraries’ choice is limited given their need to meet patron demand. As a result, rightholders have a broadly free hand to set higher prices, although of course may themselves lack the information to do so effectively.

The particular situation of libraries – in particular their mission, often set out in law, to meet the information needs of users – can make them particularly vulnerable to exercise of market power.

A competition investigation could take the information already gathered in Australia, and look to understand more broadly the degree to which libraries are constrained in decision-making, and to what extent this is allowing prices and terms for eBooks that would otherwise be impossible.


Clearly, this blog has drawn only on a limited number of examples, and can only point at possibilities, rather than draw any conclusions. Nonetheless, competition investigations into the library market are not a new idea.

In 2018, the European Universities Association proposed one looking at broader scholarly publishing, and a group of individual researchers have sought to launch a case on a specific company, as did UK researchers on the subject of non-disclosure agreements in particular.

So far, eBooks have tended not to attract quite the same attention as other fields, but with it uncertain for how long libraries are going to need to be primarily digital institutions, there may be value in a deeper look.

With public and institutional funding likely to become scarcer in the coming years, ensuring it is well spent is going to be a priority.


[Corrected on 26 May 2020 to underline that the reference to concentration in the academic market should have emphasised journals, rather than books]
Library Stat of the Week #18: Societies with more public librarians tend to have higher social mobility

In the last two Library Stat of the Week posts (#16 and #17), we’ve looked at the relationship between the numbers of public and community libraries and librarians per 100 000 people, and a key indicator of inequality, the Gini Coefficient.

Drawing on data from the Library Map of the World and the World Bank, it has been possible to show that there is an association between these. Both having more libraries, and more librarians tends to be linked to lower levels of inequality.

Indeed, as highlighted last week, even when controlling for the number of libraries in a country, having more librarians per library is also correlated with higher levels of equality.

A next step is to look at equality over time, or social mobility. The Organisation for Economic Cooperation and Development does this by looking at the level of change – or ‘elasticity’ of wages between fathers and sons.

This makes it possible to show how far someone from a poor background has a chance of finding a well-paid job or other opportunity, or whether poverty is likely to continue across generations.

This is an important indicator, not least for social cohesion and wellbeing, given that people are likely to be more optimistic about the future when the chances of improving their lives, and those of their children, are higher.

As set out in the previous blogs, libraries – and in particular public and community libraries – have a core mission to promote equity. Indeed, at the heart of the Public Library Manifesto is the idea that everyone should have access to education in order to improve their situation.

As a result, arguably, public libraries are social mobility institutions, giving everyone the chance to build better lives.

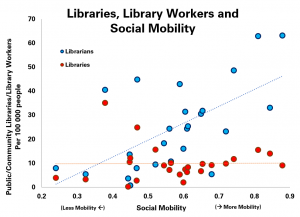
To test the connection, we can therefore compare the data already used from the Library Map of the World for the numbers of public and community libraries and librarians (numbers per 100 000 people), and the OECD’s data on social mobility (primarily available for its members – developed countries, and measured from 0-1 with 1 being the highest level of mobility), as in the below graph., with each dot representing a country for which data is available.

Graph comparing the level of social mobility in countries with the numbers of public and community libraries and librarians

This tells two contrasting tales, with seemingly relatively little link between the number of libraries per 100 000 and social mobility, but a relatively strong one between the number of librarians and mobility.

Indeed, of the top four countries for social mobility, three are also the top-performers for numbers of librarians per 100 000 people (Denmark, Finland and Norway). The only high performer on social mobility with a low number of librarians was Canada, while Hungary and France stand out for having a relatively high number of librarians, but still have lower social mobility.

As ever, correlation does not mean causality. It is true that investment in librarians is likely to be a sign of a society that cares about giving everyone an opportunity to do better. Similarly, librarianship can also be the sort of profession that allows people to be socially mobile.

It does remain a powerful message, however, that socially mobile societies tend to be those with more public and community librarians. As governments look to build more inclusive, equitable societies post-COVID-19, this is a valuable point to make.


Find out more on the Library Map of the World, where you can download key library data in order to carry out your own analysis! See our other Library Stats of the Week! We are happy to share the data that supported this analysis on request.

Library Stat of the Week #17: Greater Numbers of Librarians Per Public Library Are Associated with More Equal Societies

Last week, in the first of a sub-series looking at library and equality data, we explored the connection between the number of public and community libraries in a country, and how equal it is according to the Gini Coefficient (an indicator of inequality used in the Development and Access to Information Report).

Crossing the data showed that, globally, countries that tended to have more public and community libraries per 100 000 were also characterised by greater equality (i.e. lower Gini Coefficients).

However, it does not make sense to stop at simply counting libraries. The role of librarians and other library workers is key, providing a whole range of services to users. Their presence is also an indicator of how much countries are investing in the operations of their library services, rather than just the sunk costs of buildings.

Fortunately, IFLA’s Library Map of the World also collects data for numbers of librarians and related staff in public and community libraries, allowing us to look at the connection.

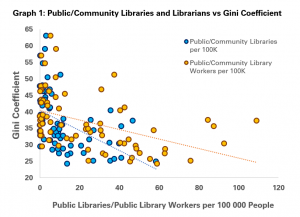
As a first step, we can look at the relationship between the number of public and community librarians per 100 000 people, and the Gini Coefficient.

Graph 1: Public/Community Librarians Vs Gini Coefficient

As the graph indicates, more public and community library workers per 100 000 people tends to be associated with a lower Gini Coefficient, and so lower inequality.

We can say that for every seven more public and community library workers per 100 000 people (or 70 per million), a country sees a 1-point drop in inequality.

Similarly, the same drop is associated with three extra public or community libraries per 100 000 people (or 30 per million).

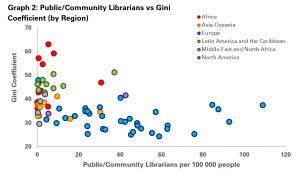
Graph 2: Public/Community Librarians vs Gini Coefficient (by Region)

A second step, as in the second graph, is to break this down by region. As with the figures last week, it is clear that European countries tend to enjoy both lower levels of inequality and higher numbers of librarians, while the inverse is true of Africa and Latin America and the Caribbean.

The final question then is whether having more or fewer public or community library workers makes a difference, once you take the number of libraries per head into account.

We can do this by looking at the relationship between having a greater or lesser degree of inequality than would be expected with a given number of public or community libraries, and having a greater or lesser than average number of public or community library workers.

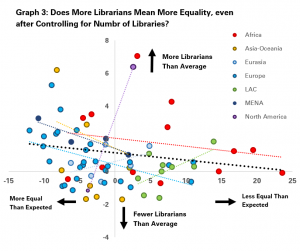
Graph 3: Does More Librarians Mean More Equality, even after Controlling for Number of Libraries?

The third graph does this, comparing the level of equality compared to expectations on the X (horizontal) axis (calculated using the trend line in the first graph) with the number of librarians per library more or less than the average on the Y (vertical axis).

The key finding here is shown with the thick black line, which indicates that in general countries with more public and community library workers per library than average also score higher than expected for equality, while those with fewer workers score lower on equality.

The same finding applies in most work regions as well, with a particularly strong trend in Western and Central Europe, as well as Africa, Asia Oceania and the Middle East and North Africa, although is not reflected in North America (just two countries), Latin America and the Caribbean and Eastern Europe (Eurasia).

As always, correlation is not causality, and it is reasonable to assume that both higher levels of equality and higher numbers of librarians are both illustrative of societies that care more about fairness and inclusion.

Nonetheless, the indication of the connection between investment in libraries and more equal societies is a welcome one as governments reflect on how to build better societies post-COVID-19.

Next week, we’ll be looking at how data on numbers of libraries and librarians relates to levels of social mobility in societies.


Find out more on the Library Map of the World, where you can download key library data in order to carry out your own analysis! See our other Library Stats of the Week! We are happy to share the data that supported this analysis on request.

Library Stat of the Week #16: Globally, having more public libraries is linked to lower inequality

Libraries have an important function in societies in promoting equity.

For those who do not have the resources to access books or who cannot afford a strong internet connection or hardware, they are a free (or low-cost) alternative.

For those who could not benefit from a good education, they provide another route back into learning.

Increasingly, libraries have expanded services – consistent with their overall mission – to find other ways to help members of society at risk of information poverty.

Given this, it is worth trying to understand what we can learn from statistics about levels of inequality in the world, and how these relate to libraries, using data from the Library Map of the World.

This post – the first in a sub-series – looks at some initial indicators of the relationship between different indicators of inequality or income distribution and the presence of libraries in a country.

While this is certainly a proxy, we will use the number of public or community libraries per 100 000 people as a measure of how well served a population is.

To understand inequality, we can take two approaches – one of the standard measures of income inequality – the Gini Coefficient – and then the percentage of the population living under national poverty lines (both using World Bank figures).

These allow us both to get a sense of how income is distributed across a population in general (i.e. how ‘fair’ or ‘unfair’ it is), and then what share of the population struggles to survive from day to day.

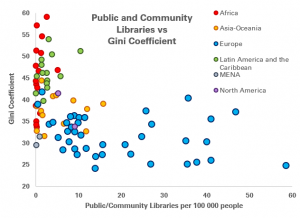
Graph comparing number of libraries per 100 000 people and the Gini coefficient

Looking at the Gini Coefficient first, as the above graph shows, there is generally an inverse relationship between the number of libraries per 100 000 people and the coefficient (a higher coefficient indicates higher inequality), indicating that the more libraries there are, the fairer a society is.

Interestingly, this relationship is less clear at the regional level, with the exceptions of North America and Europe, where there is a clear link (although obviously with North America, the sample size is small!). Globally, it becomes clear – sadly, that Africa and Latin America and the Caribbean seem to be characterised by both low numbers of public and community libraries (on the basis of the data we have) and higher levels of inequality.

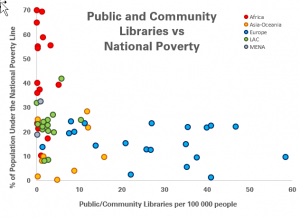
Graph comparing number of public and community libraries per 100 000 people with the share of the population under the national poverty line

Turning to the share of the population under the national poverty line (see the graph above), there is a similar inverse relation between the number living in poverty, and the number of libraries per 100 000 people.

Again, this tendency is also reflected in Europe, where an extra 10 public or community libraries per 100 000 people is linked to a fall of 1.1 percentage point in the share of the population living in poverty.

Clearly, as ever, correlation is not necessarily causation. It is likely to be the case that societies that invest more in libraries also invest more in other measures to tackle inequality. In other words, more libraries can be a symptom of a more pro-equality stance, rather than the reason for this.

Nonetheless, it stands that more libraries remains linked to higher equality and lower poverty.

To explore further, given that different countries take different approaches to the number of libraries they have (fewer, bigger ones, or more, smaller ones), we’ll look at the links between the number of library workers and indicators of equality and poverty.


Find out more on the Library Map of the World, where you can download key library data in order to carry out your own analysis! See our other Library Stats of the Week! We are happy to share the data that supported this analysis on request.

Library Stat of the Week #12: Pre-pandemic, eLending from public libraries lagged well-behind traditional lending. But in Denmark, eBooks already represented 1 in 7 book loans

With libraries around their world forced to close their doors to the public, there have been major spikes in demand for digital content, and in particular eBooks.

Of course, libraries globally have been doing what they can to develop their digital offer for users. Digital tools and materials offer a great possibility not only to provide access to more diverse content, but also to support users in remote areas or who have mobility challenges.

At the same time, they have faced challenges connected with the failure of copyright laws to keep up with the digital age, and the fact that markets have not really adapted. A long-term challenge for libraries will be to ensure that if ever such a crisis comes again, our institutions can rely on laws, not discretionary decisions, to do their jobs.

It will be a while before we can tell exactly what the impact of the pandemic on library eLending will be, but thanks to data collected through the Library Map of the World, we can already start to understand what the situation before was.

While we are still a long way from complete data on this, we can already look at the situation in a number of countries.

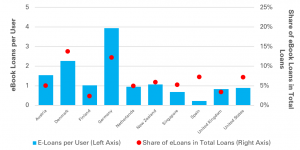
For example, in Germany, each registered user in a public or community library borrows 3.9 eBooks or other electronic documents a year (2018 figures), while in Denmark, it’s 2.3 (2018), in Austria 1.5 (2018), in New Zealand 1.1 (2016), in Finland 1 (2018) and in the Netherlands, 0.95 (2018). In both the UK (2018) and US (2014), it’s between 0.8 and 0.9, while in Singapore (2018) it’s 0.7 and in Spain (2017), it’s only 0.2.

A slightly different picture emerges when looking at how these figures relate to numbers of physical loans. Here, the biggest share of eBooks in total book loans is in Denmark, where they represent 1 in 7 loans in total, while in Germany, the figure was 1 in 8.

Graph showing both number of Ebook Loans per user in Public Libraries, and the share of eBook Loans in total loansIn both Spain and the United States, it’s 1 in 14, and New Zealand 1 in 17. Meanwhile, in all of Singapore, Australia and the Netherlands, it’s around 1 in 20 (or 5% of the total).
There are higher figures still in some developing countries, although it is not certain that data is complete. At the same time, the potential of digital lending may be particularly powerful in situations where the public and community library network is not dense.

It will be interesting to see how this graph evolves in future, in the light of the current crisis.


Find out more on the Library Map of the World, where you can download key library data in order to carry out your own analysis! See our other Library Stats of the Week! We are happy to share the data that supported this analysis on request.

Library Stat of the Week #11: Despite sparse populations, there are relatively dense public library networks in Mongolia, Kazakhstan, Russia and Canada

As highlighted last week, a key characteristic – and indeed mission – of public libraries is to provide a service that responds to the needs of their communities.

This job can be made more difficult when the distance between people and libraries is greater, for example in rural communities. For people who lack transport, or are mobility impaired, the challenge is particularly acute.

In last week’s Library Stat of the Week, we looked at the density of public and community library networks by analysing how big an area – on average – each public library serves.

As could be expected, the densest networks were often in very small territories such as Macao, China, Hong Kong, China, and Singapore, although there were similar figures for areas served in some larger countries such as Czechia and India. The least dense networks were in very large countries and territories, such as Greenland, Australia, Mongolia and Canada.

Graph comparing population density and library densityThe next step is to look at the relationship between population density and library density.
Graph comparing population density and library density

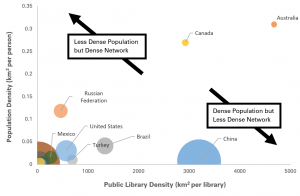
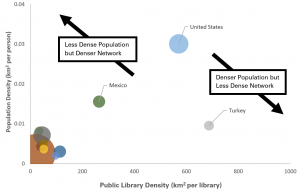
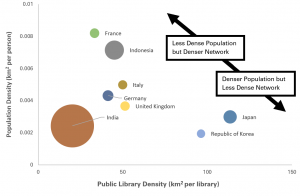
In the three graphs shown here, we compare the situation for G20 countries (with the exception of Saudi Arabia, for which public library data is not possible), with the size of dots indicating the population of each country concerned.

Graph comparing population density and library density

This makes it possible to explore to what extent countries with similar levels of population density have a more or less dense library network.

For example, China and Mexico have a similar level of population density, but Mexico has a much denser network. The same goes for India and Japan, where despite similar levels of population density, but India has a much closer network of libraries. In contrast, despite a much sparser population, the United States still has a closer public library network than Turkey.

Looking globally, we can calculate a global trend, and then calculate how much denser – or less dense – any given country’s public and community library network is in comparison with this.

Doing this, we can then calculate that it is in Mongolia, Kazakhstan, Russia and Canada that public library density is highest, once population density is taken into account. In effect, there is a form of ‘over-compensation’ for the sparsity of their populations, helping ensure that citizens have easier access to libraries.

At a regional level, it is Europe and Asia that have the densest networks after taking account of population density.

Meanwhile, Africa and the MENA region have the least dense networks of libraries, even after taking population density into account. It is in these countries in particular that efforts to boost not only coverage, but also digital tools which make it possible to overcome distance, are particularly pressing.

Of course, as highlighted in last week’s blog, a complete idea of how far individuals need to travel to reach a library can only be obtained with detailed data about where libraries are, and where people live. Nonetheless, this analysis gives a first idea of how different countries approach public and community library provision.


Find out more on the Library Map of the World, where you can download key library data in order to carry out your own analysis! See our other Library Stats of the Week! We are happy to share the data that supported this analysis on request.

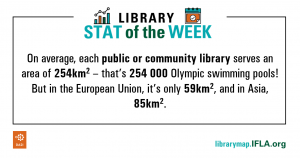
Library Stat of the Week #10: On average, each public or community library serves an area of 254km2 – that’s 254 000 Olympic swimming pools! But in the European Union, it’s only 59km2, and in Asia, 85km2

Library Stat of the Week #10: On average, each public or community library serves an area of 254km2 - that's 254000 Olympic Swimming Pool! But in the European Union it's only 59km2, and in Asia, 85km2One of the key strengths of libraries – in particular public and community libraries – is the fact that they are local.

Being close to the communities they serve gives them a unique potential to understand what people need, and to provide collections and services accordingly.

Of course, ‘closeness’ is about more than just geography, but this does undoubtedly play a role. When a single library needs to service a large area – for example rural or sparsely populated ones – it can be more difficult to ensure support to everyone who lives there. This is a particular concern for people who are disabled or otherwise find it difficult to move around.

Clearly detailed data about the average distance for any given individual to a library requires disaggregated data at the local level.

However, we can start to understand in which countries people may risk being the furthest away from libraries by calculating the average area that any given public or community library serves. We can do this by taking World Bank figures on the surface area of countries, and dividing this by the number of public and community libraries, as reported on IFLA’s Library Map of the World.

This gives us a total figure – for reporting countries – of 254km2 served per library – the equivalent of 254 000 Olympic swimming pools (each pool is 1000m2). There is – as always – variation! At the regional level, the European Union has the highest density of public libraries – one for every 50km2. Asia comes next, with one library for every 85km2.

At the national level, Asia claims both of the top spots, with Macao (one library for every 0.4km2) and Singapore (one every 2km2). Czechia has the densest network in Europe (one library for every 13km2), Moldova in non-EU Europe (one every 25km2), Réunion in Africa (one every 31km2), St Lucia in Latin America and the Caribbean (one every 32km2), Bahrain in MENA (one every 65km2), and New Zealand in Oceania (one every 631km2).

Clearly, as highlighted before, these figures are averages, and a more detailed understanding of how far people need to travel to get to a library requires more disaggregated data. Next week, we’ll move a step closer by looking at how population density and library density are related.


Find out more on the Library Map of the World, where you can download key library data in order to carry out your own analysis! See our other Library Stats of the Week! We are happy to share the data that supported this analysis on request.