Tag Archives: #LibraryStatOfTheWeek

Library Stat of the Week #11: Despite sparse populations, there are relatively dense public library networks in Mongolia, Kazakhstan, Russia and Canada

As highlighted last week, a key characteristic – and indeed mission – of public libraries is to provide a service that responds to the needs of their communities.

This job can be made more difficult when the distance between people and libraries is greater, for example in rural communities. For people who lack transport, or are mobility impaired, the challenge is particularly acute.

In last week’s Library Stat of the Week, we looked at the density of public and community library networks by analysing how big an area – on average – each public library serves.

As could be expected, the densest networks were often in very small territories such as Macao, China, Hong Kong, China, and Singapore, although there were similar figures for areas served in some larger countries such as Czechia and India. The least dense networks were in very large countries and territories, such as Greenland, Australia, Mongolia and Canada.
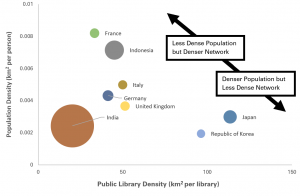
Graph comparing population density and library densityThe next step is to look at the relationship between population density and library density.
Graph comparing population density and library density

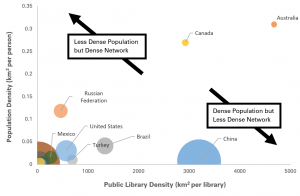
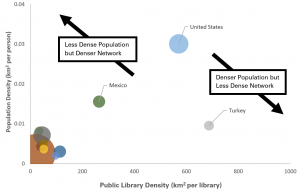
In the three graphs shown here, we compare the situation for G20 countries (with the exception of Saudi Arabia, for which public library data is not possible), with the size of dots indicating the population of each country concerned.
Graph comparing population density and library density

This makes it possible to explore to what extent countries with similar levels of population density have a more or less dense library network.

For example, China and Mexico have a similar level of population density, but Mexico has a much denser network. The same goes for India and Japan, where despite similar levels of population density, but India has a much closer network of libraries. In contrast, despite a much sparser population, the United States still has a closer public library network than Turkey.

Looking globally, we can calculate a global trend, and then calculate how much denser – or less dense – any given country’s public and community library network is in comparison with this.

Doing this, we can then calculate that it is in Mongolia, Kazakhstan, Russia and Canada that public library density is highest, once population density is taken into account. In effect, there is a form of ‘over-compensation’ for the sparsity of their populations, helping ensure that citizens have easier access to libraries.

At a regional level, it is Europe and Asia that have the densest networks after taking account of population density.

Meanwhile, Africa and the MENA region have the least dense networks of libraries, even after taking population density into account. It is in these countries in particular that efforts to boost not only coverage, but also digital tools which make it possible to overcome distance, are particularly pressing.

Of course, as highlighted in last week’s blog, a complete idea of how far individuals need to travel to reach a library can only be obtained with detailed data about where libraries are, and where people live. Nonetheless, this analysis gives a first idea of how different countries approach public and community library provision.


Find out more on the Library Map of the World, where you can download key library data in order to carry out your own analysis! See our other Library Stats of the Week! We are happy to share the data that supported this analysis on request.

Library Stat of the Week #10: On average, each public or community library serves an area of 254km2 – that’s 254 000 Olympic swimming pools! But in the European Union, it’s only 59km2, and in Asia, 85km2

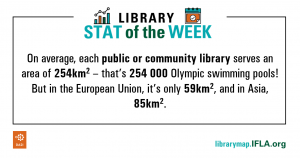
Library Stat of the Week #10: On average, each public or community library serves an area of 254km2 - that's 254000 Olympic Swimming Pool! But in the European Union it's only 59km2, and in Asia, 85km2One of the key strengths of libraries – in particular public and community libraries – is the fact that they are local.

Being close to the communities they serve gives them a unique potential to understand what people need, and to provide collections and services accordingly.

Of course, ‘closeness’ is about more than just geography, but this does undoubtedly play a role. When a single library needs to service a large area – for example rural or sparsely populated ones – it can be more difficult to ensure support to everyone who lives there. This is a particular concern for people who are disabled or otherwise find it difficult to move around.

Clearly detailed data about the average distance for any given individual to a library requires disaggregated data at the local level.

However, we can start to understand in which countries people may risk being the furthest away from libraries by calculating the average area that any given public or community library serves. We can do this by taking World Bank figures on the surface area of countries, and dividing this by the number of public and community libraries, as reported on IFLA’s Library Map of the World.

This gives us a total figure – for reporting countries – of 254km2 served per library – the equivalent of 254 000 Olympic swimming pools (each pool is 1000m2). There is – as always – variation! At the regional level, the European Union has the highest density of public libraries – one for every 50km2. Asia comes next, with one library for every 85km2.

At the national level, Asia claims both of the top spots, with Macao (one library for every 0.4km2) and Singapore (one every 2km2). Czechia has the densest network in Europe (one library for every 13km2), Moldova in non-EU Europe (one every 25km2), Réunion in Africa (one every 31km2), St Lucia in Latin America and the Caribbean (one every 32km2), Bahrain in MENA (one every 65km2), and New Zealand in Oceania (one every 631km2).

Clearly, as highlighted before, these figures are averages, and a more detailed understanding of how far people need to travel to get to a library requires more disaggregated data. Next week, we’ll move a step closer by looking at how population density and library density are related.


Find out more on the Library Map of the World, where you can download key library data in order to carry out your own analysis! See our other Library Stats of the Week! We are happy to share the data that supported this analysis on request.
Library Stat of the Week #9: Globally, one in every 1525 workers is a member of library staff, but it’s 1 in 613 in North America, and 1 in 237 in Estonia!

Library Stat of the Week 9 - Globally, one in every 1525 workers is a member of library staff, but it's 1 in 613 in North America and 1 in 237 in EstoniaLast week, we looked at the number of librarians for every 100 000 people around the world, with Oceania coming in highest at 84 – that’s one in every 1190 people.
But what about library staff in the workforce? How big a share of jobs are as librarians and related staff members (defined as librarians, other professional staff, project staff and assistants)?

This matters because in addition to the role that libraries play in their communities, librarianship in itself is a significant profession, like journalism, publishing, or architecture.

Librarians can also contribute to the success of businesses and other organisations through effective knowledge management and presentation.

In order to understand how big a share of the workforce librarians represent, we therefore compared Library Map of the World data on number of library staff (including librarians, assistants and project staff) with World Bank figures on the size of the workforce.

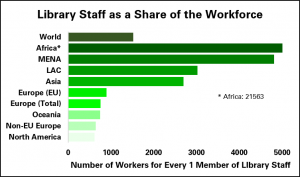
Globally – or at least for the 111 countries for which we can carry out the analysis – there are 2.1 million library staff in a workforce of 3.2 billion. This means that one in every 1525 workers is a librarian or other professional staff member.

Graph showing the number of library staff as a share of the workforce

But as always, this varies, with North America having the biggest share of librarians in the total workforce – 1 in 613, closely followed by Europe outside of the EU at 1 in 650 (the figure for Europe as a whole is 1 in 759) and with Oceania a little further behind at 1 in 748.

In eleven countries, 1 in 500 or fewer workers is a library staffer, with Estonia coming in top at 1 in 237. Cuba scores highest outside of Europe at 1 in 374 (Chile comes in on 1 in 517).

In Asia, Macao has the largest share of librarians in the workforce (1 in 514), in North America it’s the United States (1 in 589), in Oceania it’s Australia (1 in 590), in the Middle East and North Africa it’s Qatar (1 in 3126) and in Africa it’s Namibia (1 in 3934).

To give a sense of comparison, this means that in a country like the United States, for example, there are almost three times as many library staff as there are architects, while in the UK, there are 50% more library staff than there are people working in publishing.


Find out more on the Library Map of the World, where you can download key library data in order to carry out your own analysis! See our other Library Stats of the Week! We are happy to share the data that supported this analysis on request.


Library Stat of the Week #8: The Oceania region has the highest number of library staff per 100 000 people – over 84 – but Belarus has the highest for a single country at 227!

One of the key attractions of libraries as places to deliver public policy goals are librarians and other library staff – professional and qualified staff, plus project staff and assistants.

With either specific library qualifications or bringing other skills, they are vital for ensuring that users receive the support they need, and keeping spaces welcoming and friendly. Through their initiatives, libraries can become skills hubs, cultural centres, and portals to open government information, to give just a few examples.

While there is a growing reliance on volunteers, and even experimentation with staff-less libraries, in some countries, none of this lessens the value of professional staff.

Library Map of the World Data already gives an idea of how many library staff there are globally – over 1.5 million!

Comparing this with population data from the World Bank allows us to go further and understand how many librarians and other library staff are at work for every 100 000 people – the size of a large town or small city.

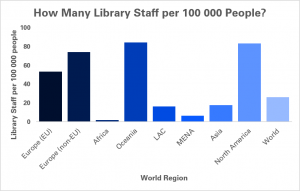
Graph showing number of library staff per 100 000 people in different world regions

Looking across regions, and countries for which data is available, it is possible to show that Oceania has the highest number of library staff per 100 000 people – 84.4, with North America close behind at 83.3. Globally, the figure is 26.3 – roughly one librarian for every 3 800 people.

Nationally, the variation is much stronger – Belarus has the highest number of librarians per 100 000 people at 226.8, with Estonia not far behind at 221.

In other regions, Macao China has the most in Asia (121.4), Cuba in Latin America (119.9), Australia in Oceania (89.8), the United States in North America (86.1), Qatar the most in the Middle East and North Africa (24.5) and Namibia the most in Africa (10).


Find out more on the Library Map of the World, where you can download key library data in order to carry out your own analysis! See our other Library Stats of the Week! We are happy to share the data that supported this analysis on request.

Library Stat of the Week #7: High rates of library connectivity in Kenya, Thailand and Mongolia offer potential for digital skills programming

In our 6th Library Stat of the Week, we looked at the share of public libraries which offer internet access in countries for which data is available.

As underlined, being able to provide this access is an increasingly important way for libraries to achieve their mission to give access to information.

The possibility to give access also means that libraries can host digital skills training, from the most basic abilities to more advanced capabilities. Such training can be particularly important in countries where people are less used to the internet, and so have not had the possibility to develop digital literacy.

Many funders are keen to support such initiatives. But how to identify where it could be easiest to do so?

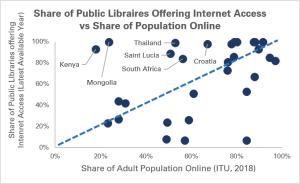
One way is to look at data about the share of public libraries which offer internet access compared to the share of adults with their own internet access. Where there are higher levels of library connectivity (share of public libraries offering internet access), but lower levels of general connectivity (share of the adult population online), potential funders of digital skills programmes may have a particular interest in working with libraries.

We can identify these countries by crossing data from the IFLA Library Map of the World with that from the International Telecommunications Union:

Graph comparing shares of libraries offering internet access with shares of the population online

In this graph, each dot is a country for which data is available. Every country over the diagonal line has a higher rate of library connectivity than of general connectivity.


This gap is particularly high in Kenya, Mongolia, Saint Lucia, Thailand, Croatia, Kenya and South Africa, suggesting that they may be particularly interesting places to invest in digital skills programmes in libraries.

Clearly, as ever, the data is incomplete – figures for public library connectivity are only available for 30 countries, and there is the possibility of under-reporting. Nonetheless, this underlines the possibility to apply Library Map of the World data to support this sort of decision-making.


Find out more on the Library Map of the World, where you can download key library data in order to carry out your own analysis! See our other Library Stats of the Week! We are happy to share the data that supported this analysis on request.

Library Stat of the Week #6: Almost 2/3 of public libraries offer internet access globally. In Russia, over 27 000 public libraries do so!

Libraries have always been about access to information, in the present and into the future.

Traditionally – and of course this is what gave them their name – they were about books.

However, with a growing share of information now online – including from sources that used to be printed – internet access has, in many places, become a core part of the library ‘offer’ to users.

Libraries can bring particular strengths to this. Clearly, public internet access in itself provides a solution for people who do not have their own connection.

But it can be combined with other services, such as access to terminals, training, or wider support. Libraries can even act as nodes in wider connectivity schemes.

But how many libraries are already connected to the internet, and offering this possibility to their users?

Data from IFLA’s Library Map of the World allows us to start building an understanding of the situation, using latest available numbers.

For the moment, 30 countries from almost all world regions (only North America is missing) have submitted data about both the number of public libraries they have, and the number offering internet access.

Across this group, almost 2/3 (64%) of all public libraries offer internet access, with the largest single number being in Russia, with over 27 000.

In Europe, a number of countries have internet access in all public libraries, including Estonia, Latvia, Slovenia, Andorra and Finland. In Africa, 92% of Kenya and 84% of South African public libraries offer access. In Latin America, 89% of libraries in Saint Lucia do so, while in Asia, there are figures of 100% for Mongolian and 99% for Thai public libraries.

These figures help underline both the potential in some countries to use libraries as a network for digital public projects, as well as the need for investment in others.

Find out more on the Library Map of the World, where you can download key library data in order to carry out your own analysis! See our other Library Stats of the Week! We are happy to share the data that supported this analysis on request.

Library Stat of the Week #5: Globally, Finland and Macao have the highest average public library visits per person per year, while Oceania is the highest placed region

Even as the online world plays an ever more important role in our lives, there has been a growing recognition of the need for physical spaces where people can feel welcome and mix with others.

Public and community libraries offer just such a space, with dedicated staff and without any profit motive. As such, they can also be great platforms for partnerships, as well as shop-windows for other public services.

But how often are people visiting, on average? Library Map of the World data makes it possible to calculate this for 81 countries for at least one of the last three years.

We took figures for the number of visits to public libraries for the last year when data was available, and divided them by 2018 population figures from the World Bank.

What does this tell us?

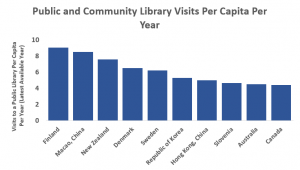
Globally, Finland and Macao, China had the highest average public library visits per person per year (9.03 and 8.51), while Oceania is the highest placed region (5.02 visits per person per year), and North America the second (4.16).

Encouragingly, countries from four different regions appeared in the top ten (Europe, North America, Asia and Oceania).

Graph showing number of visits per person per year to public libraries (top ten countries/territories)

These figures are likely to be conservative. For some countries, figures for numbers of visits are likely to be underestimates. We can expect, therefore, than in many countries, the number of recorded visits will rise. Furthermore, these figures are only for 81 countries – Oceania for example only has two reporting countries.

Finally, the number of visits per head doesn’t tell us everything. We can’t tell what people are doing in the library – how long they are spending there, what they are doing. Indeed, one of the strengths of libraries is the freedom given to users to choose how to use it.

However, once again, these figures can hopefully start a discussion, and demonstrate the levels of use that are possible.


Find out more on the Library Map of the World, where you can download key library data in order to carry out your own analysis! See our other Library Stats of the Week! We are happy to share the data that supported this analysis on request.